2. Dashboard

2.1. Transaction Monitor

Transaction monitor is available at the top of the page for general statistics:

pic5 manager faq

This monitor contains the following blocks:

Turnover

The sum of all successful sale, capture, reversal (refund) and transfer operations

Declined, filtered and verify

The number of operations of the aforementioned types with the corresponding status

Chargebacks

The number and amount of successful chargeback and prearbitration operations

Frauds

The number and amount of successful fraud operations

Reversals

The number and amount of successful reversal and void operations

To view the analytics detailed by each payment method, click the pointer on the right side of the relevant block:
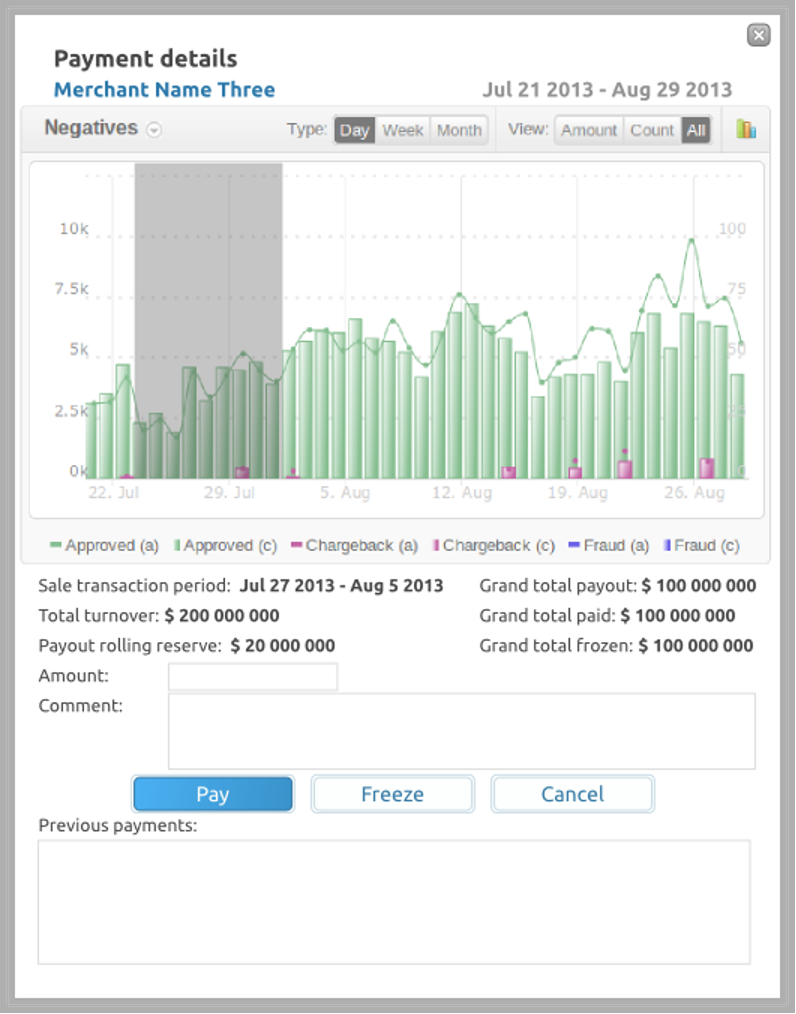

pic6 manager faq

2.2. Analytics

Data Scope

To change the range of statistics, use the switches:

pic7 manager faq

Set the desired date range in the pop-up calendar:

pic8 manager faq

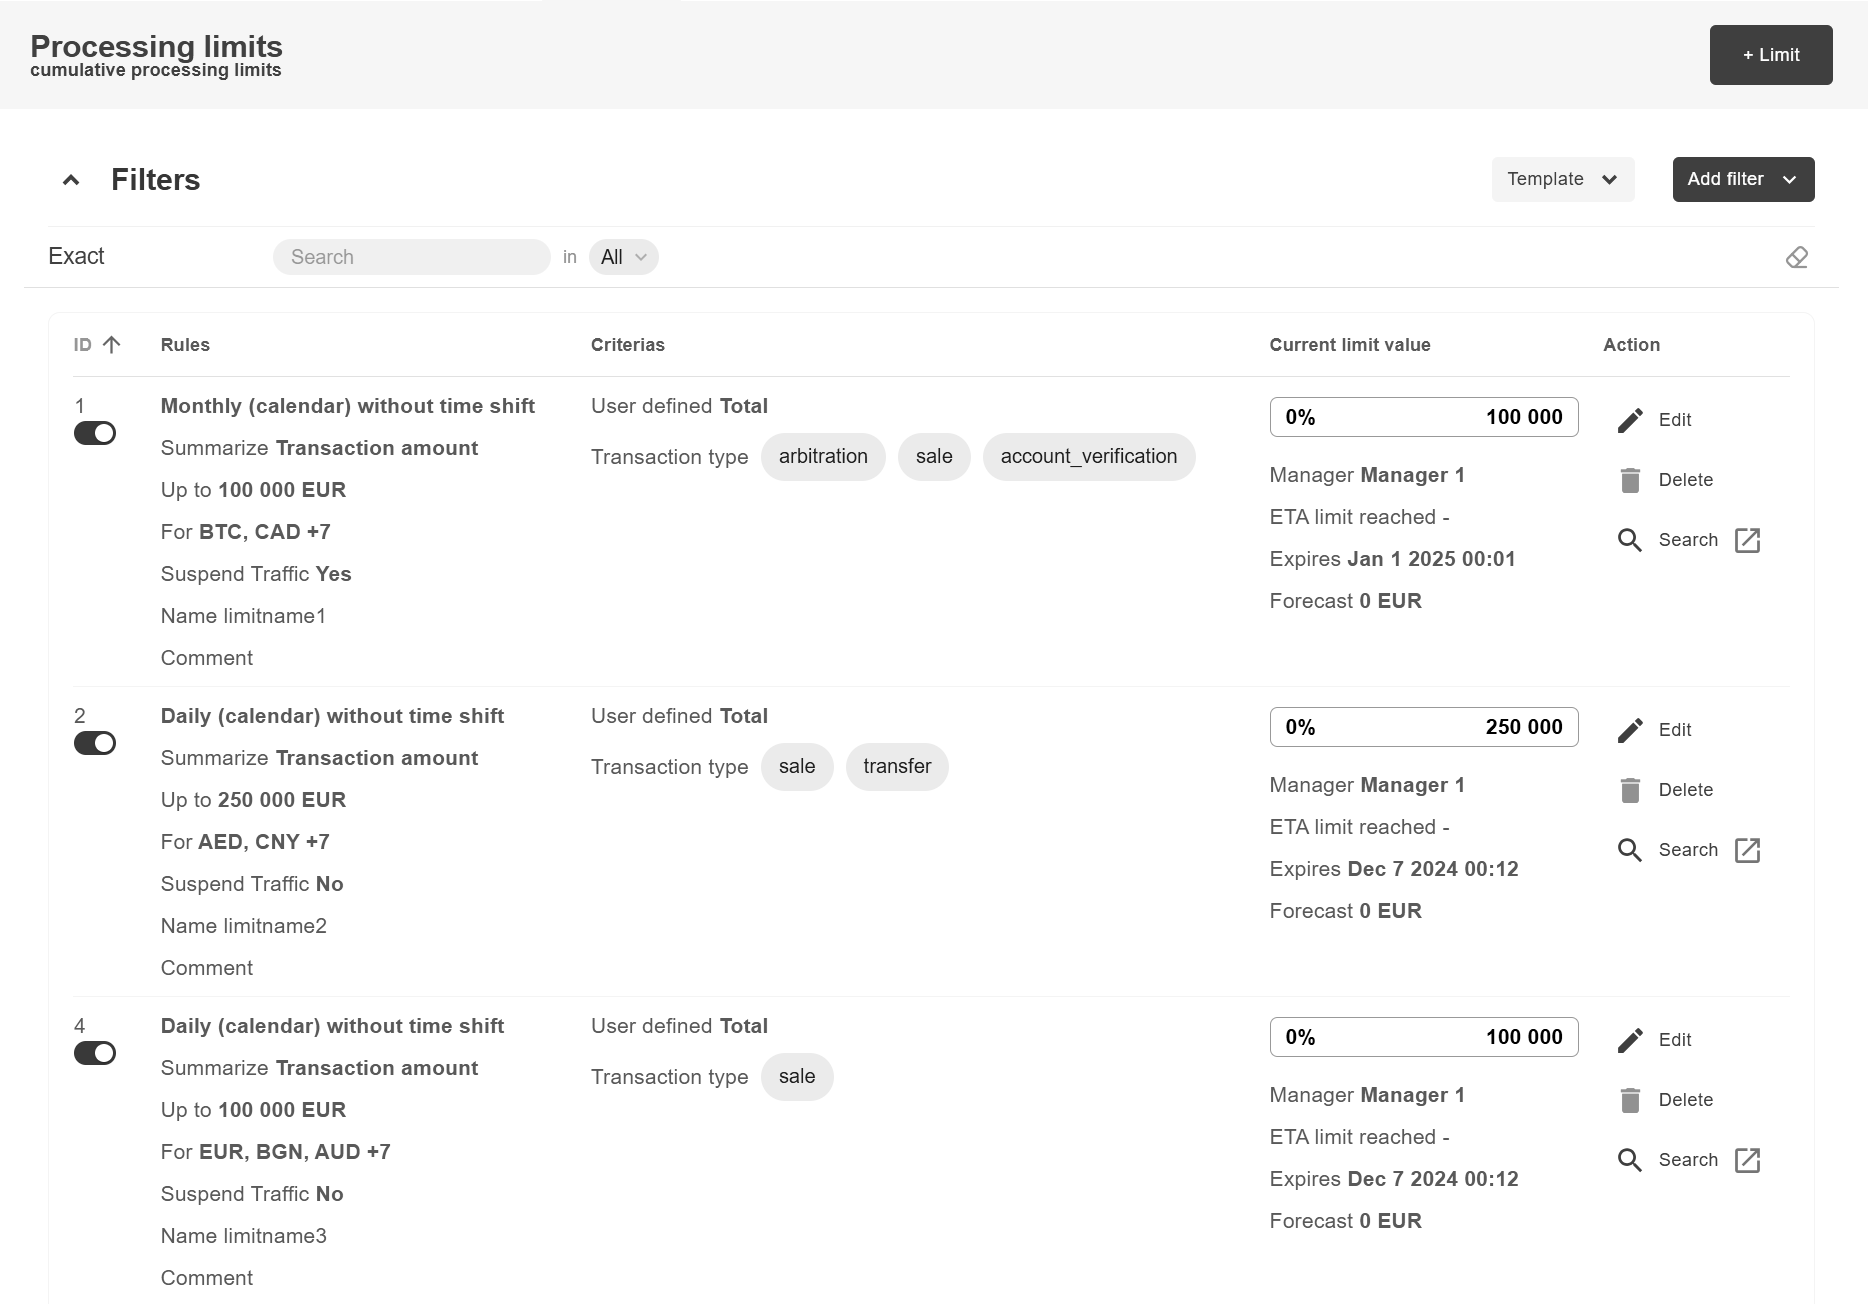
Data for graphs can be sorted using the Criteria button:

pic9 manager faq

Currencies, payment methods, as well as endpoints, projects and other data can be specified for analysis. Here is the example of the payment method selection to construct the chart:

pic10 manager faq

Turnover


Ratio of successful, rejected and filtered by the system transactions are displayed in the following graph:

pic11 manager faq
The following graphs can be also selected by pressing the v button: the ratio by volume of transactions or by amount of payments, as well as by type of transactions (sale, capture, transfer, etc). Payneteasy Payment Gateway also displays statistics on negative activity and earnings.
Required time period is set by schedule switch (day, week, month):

pic12 manager faq

Type of chart (amount, count, all) can be changed using the button:

pic13 manager faq

Approval Ratio

The graph shows the proportions between successful, declined and filtered transactions for a selected period of time.
Payneteasy Payment Gateway also displays statistics per card payment system, per currency, as well as per payment method.
Successful Transaction Analytics for the specified period are displayed as follows:

pic14 manager faq

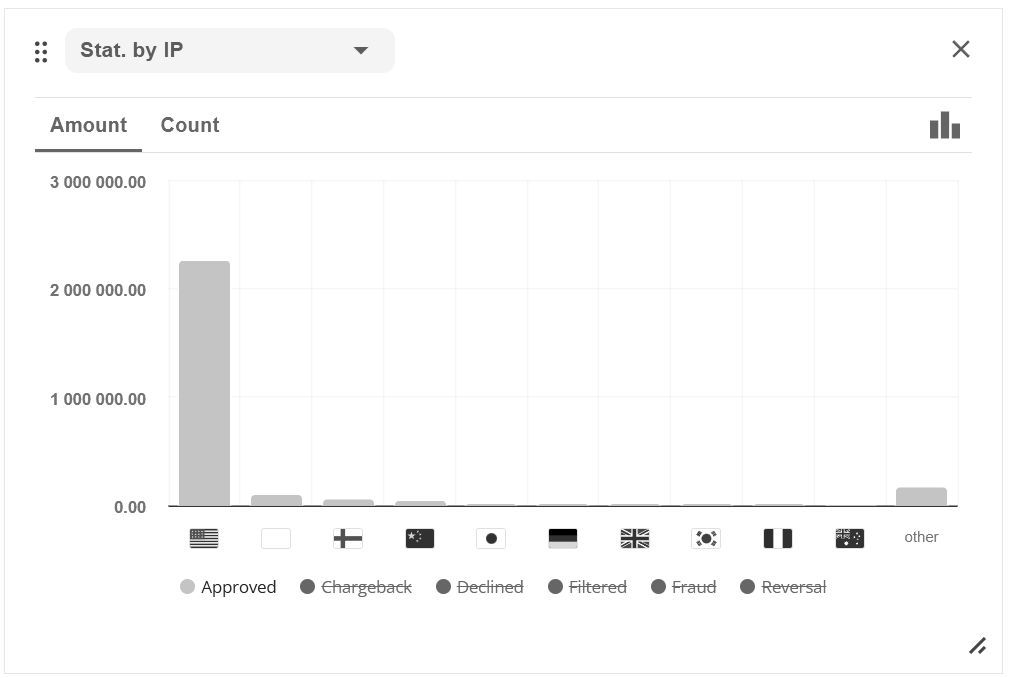
Transactions By Country

Overview of analytics by country displays two types of regional statistics: based on customer IP addresses and on card BINs.

pic15 manager faq

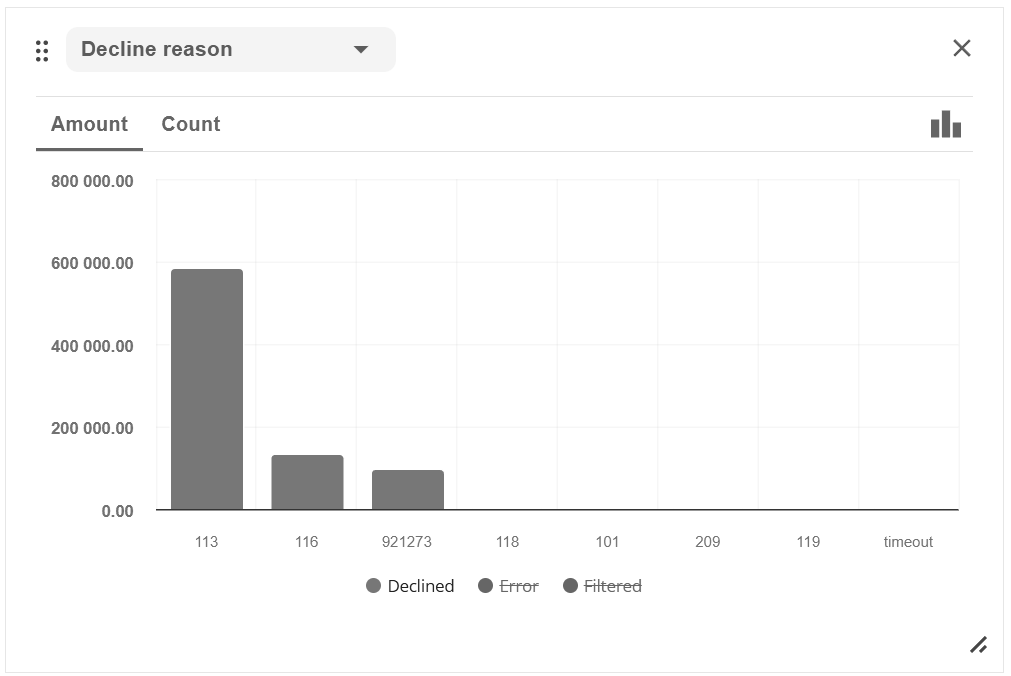
Transaction Decline Reasons

This statistics screen can be used for a visual assessment of the most frequent decline reasons, as well as chargeback and fraud reasons.

pic16 manager faq

2.3. Quick Actions

Frequently used functions can be accessed at the bottom of this page:

pic18 manager faq

This block also displays current statistics on the status of transactions:

pic19 manager faq

To browse transactions with the selected status, click on the Show button:

pic20 manager faq